
The following is an excellent article. Well researched. Presented in a very scientific manner. One factor I’ve never heard or read is the fact that the world went from BEING PERFECT — and the failure to understand that, consider that, and while man fell due to our sin, our rebellion against God THE PERFECTLY CREATED EARTH, by God, began to groan in its travail at going from perfection to entropy, to begin a slow process of decline, decay, demise.
All directly tied to man and woman’s sin.
All of creation radically, and dramatically began to change after the flood. Which occurred not that long, really, after the creation. Ever really read the whole account? Why the flood occurred? The whole story? Beyond the Sunday school edition? Perhaps it’s time to go to Genesis and do so.
And what did Jesus say?
“But as the days of Noah were, so also will the coming of the Son of Man be. For as in the days before the flood, they were eating and drinking, marrying and giving in marriage, until the day that Noah entered the ark, and did not know until the flood came and took them all away, so also will the coming of the Son of Man be.”
Matthew 24:37-39
Matthew 24
Everything on earth began to slowly change due to our disobedience. Our sin. All of creation wasn’t going to appear radically different overnight or quickly. Think about that. Ever pause to think about that? About this?
Sin is the main global factor in the decline of everything and the speed at which it declines, erodes, ends up destroyed. Either within and by an individual that continues to rebel and refuses to repent, or a once perfect world that has to endure and house the ever increasing amount of sinners and their always increasing sin and their ever increasing denying of God and falling further, deeper into depravity, debauchery, and decadence.
Turning to more false dead gods. More coveting, more wantonness, more, more, more with always less, less, and less godliness, fear of God, love of the Lord.
For I consider that the sufferings of this present time are not worthy to be compared with the glory which shall be revealed in us. For the earnest expectation of the creation eagerly waits for the revealing of the sons of God. For the creation was subjected to futility, not willingly, but because of Him who subjected it in hope; because the creation itself also will be delivered from the bondage of corruption into the glorious liberty of the children of God. For we know that the whole creation groans and labors with birth pangs together until now. Not only that, but we also who have the firstfruits of the Spirit, even we ourselves groan within ourselves, eagerly waiting for the adoption, the redemption of our body. For we were saved in this hope, but hope that is seen is not hope; for why does one still hope for what he sees? But if we hope for what we do not see, we eagerly wait for it with perseverance.
Romans 8:18-25
We live in the time, the End of Days, the last of the last days wherein sin along with increased population reveals to us in real time, in our lifetimes that which earlier took hundreds, even thousands, ten thousands of years to occur.
If God had not shortened the days even the elect would be lost…
Know why it always feels as if time is rushing by? There’s never enough time? Because it is! It wasn’t always like this. The entropy wasn’t at this point. The groaning of all creation was never at the fever pitch in all of world history it now is.
How many perceive, see, know, feel, understand — think? Get this?
It’s all racing to the end.
All because of our rebellion, our sin, our denial, our disobedience, our eternal detriment if understanding, repentance, true heartfelt to the bone of the heart repentance isn’t accomplished, the confession of sin and rushing to the Lord Jesus Christ as our Savior, Redeemer, Friend…
Read on…
Ken Pullen, Sunday, October 13th, 2024
The extreme rarity of long-lived people in the post-Flood era
11 October 2024
Reprinted from Creation.com
The post-Flood patriarchs had extended lifespans, yet scant evidence exists for extremely old people in the archaeological record. There is a simple mathematical reason for this discrepancy: their extreme rarity in the exponentially growing post-Flood population. The post-Flood decrease in lifespan follows a clear mathematical progression. It should be possible, therefore, to estimate the spectrum of expected lifespans in the population as it grew. A population model was created that assigned maximum ages to each person based on the average number of generational steps between them and Noah. An actuarial death rate table was used to induce mortality each year, and population growth was controlled with prespecified life history patterns (e.g. year of maturation, number of years between children, and age of menopause). In the end, it was shown that long-lived people were numerically overwhelmed by shorter-lived people in nearly all scenarios. Part of this was due to the rapid buildup of individuals with the maximum number of generational steps from Noah. The oldest children in a family generally have children before their younger siblings. Thus, the lifespans of the average person in the population quickly drops even as long-lived people continue to have children. In the model presented here, there is also a clear difference between potential lifespan and realized lifespan. This solves several riddles, both in archaeology and in Scripture.
Genesis chapters 5 and 11 contain a list of names that trace descent from Adam to Noah and from Arphaxad to Terah, respectively. By linking additional data, one can build a chronogenealogy1 that spans the Flood year, giving us a complete chronology from Adam to Abraham, then forward in time at least to King Manasseh of Judah.2 Lifespans were steady in the antediluvian world (Genesis 5), averaging 857 years (± 57 SD) from Adam to Noah (excluding Enoch). After the Flood, lifespans decreased precipitously, reaching the modern average after a few dozen generations. Thus, the earliest periods in human history should include evidence for people who were much older than the modern average lifespan. Such evidence has not been found in the archaeological record. This discrepancy has caused, alternately, defenses3 and rejections4 of the straightforward biblical claims.
Consider the famous passage where Jacob met the Egyptian pharaoh. He was asked but one question, “How old are you?” (Genesis 47:8). Jacob was 130 at the time, but the question attains significant relevance when you realize that Jacob’s grandfather, Abraham, had visited Egypt fully 200 years earlier (Genesis 12:10–20). Yet, since a pharaoh is generally the scion of a long line of oldest sons, perhaps 10 generations had happened in his family tree over that same 200 years. Jacob was an aberration in Pharaoh’s world. In fact, long-lived people would have been beyond the experience of nearly all ancient people, even during the time when the Bible says they still walked the earth.
One can add additional people to the list of post-Flood lifespans by pulling in multiple data points from outside the Genesis 11 chronogenealogy. Doing so creates a list of 32 people, spanning up to 38 generations (e.g. Noah through to Manasseh),5 all of whom are reported to have died natural deaths, but not all of whom are in the direct line of descent from Noah to Jesus. By fitting a curve to the lifespan data, one sees that each generation lives less than the previous generation, in a clear mathematical relationship (figure 1). Here, I am taking the data in a straightforward manner, assuming no generational gaps6 and no stylistic,7 spiritualistic,8 or symbolic9 numbering schemes. The data outside Genesis 11 fit the exponential decay curve almost precisely, so there is little reason to not take it at face value. The alternative explanation, that an ancient scribe modified the lifespans of random people scattered throughout the several scrolls that made up the Old Testament canon, to get them to follow some geometric progression, can be safely discounted.
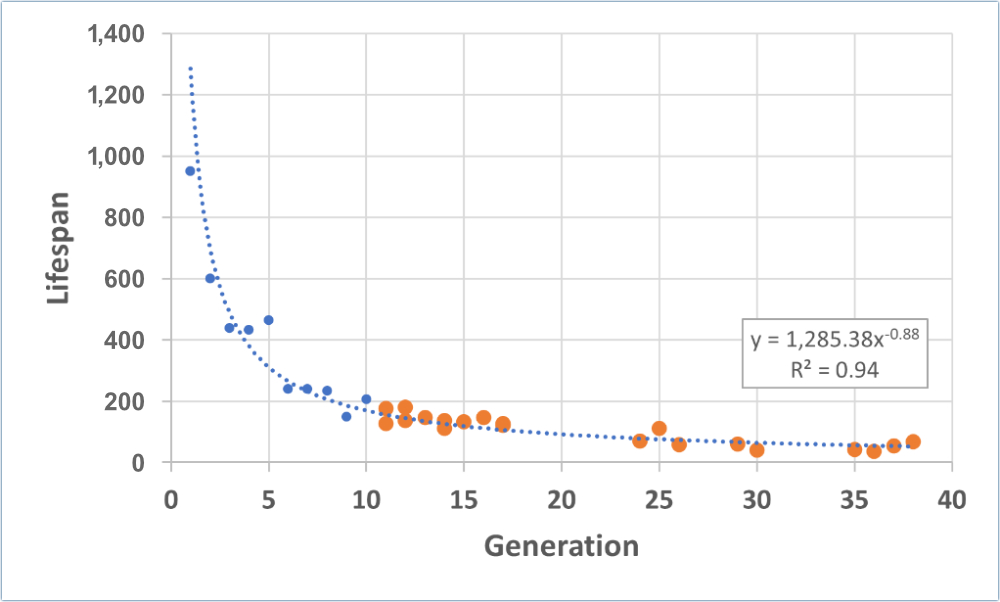
Figure 1. Lifespan vs number of generations from Noah for various biblical figures. Included are all biblical figures for whom we have a death age and a clear genealogy. Blue dots = data from Genesis 11. Orange dots = data outside Genesis 11. The terminal person is King Manasseh of Judah. See table 1 in Carter (2021)2 for additional details.
And yet, the scriptural data represent a one-off experiment. There is no replication and there is considerable ‘scatter’ about the regression line in figure 1. Stochasticity is expected when so few data points are involved, forcing us to adopt mathematical approximations. Assuming the regression in figure 1 is a good approximation for the decline in lifespan per generation (using ‘birth year’ on the x-axis produces a worse fit than using ‘generation’), one can begin to make assumptions about lifespans in the general population.
Using a well-established population model,10-13 this study attempts to quantify the spectrum of lifespans as it unfolded over time in the post-Flood world. This directly addresses, and answers, questions about the lack of long-lived people in the archaeological record.
Methods
The population model of Carter (2019)13 was modified to track the number of generational steps between each individual and Noah. Since any given individual can trace back to Noah along multiple pathways of various lengths, and since the greatest effect on an enhanced lifespan would be from the shortest pathway, the average minimum number of generations for the father (genf) and mother (genm) were used to calculate that of the child. The regression in figure 1 was used to assign to each individual a maximum lifespan (e.g. 1,285.4 × geni–0.88). Since this formula would produce very short lifespans after many generations, a minimum lifespan of 85 years was applied to each model run. This point was reached at the 22nd generation. During each modelled year, old people were removed from the population first, giving room for new births. Unmarried people who were above the age of maturation (e.g. 20 years), were then paired up at random. Previously married women were then tested to see if enough time had elapsed since their last birth (e.g. 3 years). Births were assigned at random, with a 1/3 probability of a woman giving birth in any given year, up to the age of menopause (e.g. 80% of lifespan). Each of these parameters were adjustable, but these values were used in the experiments reported here.
The next step was to randomly reduce population size according to a modern actuarial life expectancy table.14 The death probability at each age was scaled according to expected lifespan (scaled age = age × minlifespan/lifespan). But, since long-lived people were subject to this elimination round every year, very few would be able to reach their expected age of death. Thus, to produce biblically relevant results, some way of enhancing their survival was necessary. Three models were explored: 1) no adjustment; 2) the death probability was multiplied by the ratio of age/lifespan, giving long-lived people an added advantage that waned as they aged; 3) the reduction step was skipped at equal intervals to give all people the same number of tests, based on their maximum possible lifespan (e.g. a maximum of 85 tests per individual). The third model was used for all results reported here.
The final step was to reduce the population size at the end of each year to match the maximum allowed size for each model run, if necessary. This was done by randomly removing individuals. Total lifespan was not factored into this final step, meaning any individual was as likely to be eliminated. Allowing the population to grow to a large size (e.g. 1,000,000), gave more time for the Patriarchs and Matriarchs to live before they were subjected to this random reduction process, but even this did not hold it back for long since all populations grew quickly.
Results
Population size increased quickly in all model runs (table 1). Once attaining the maximum population size, 2% to 3% of the population had to be randomly culled at the end of each year. This was after people who had reached their maximum lifespan had been removed and after the actuarial life expectancy curve was applied to the population. Running models with larger population sizes (e.g. 1,000,000 individuals), did not significantly affect any of the results reported here, but they took much more time to run to completion, so what follows is a summary of population models with 100,000 individuals. In all population models, the age distribution quickly took on the expected appearance (figure 2).
Time to reach various population sizes in a population using default parameters:
Population Size Years to Reach
100 69
1,000 137
10,000 203
100,000 271
1,000,000 339
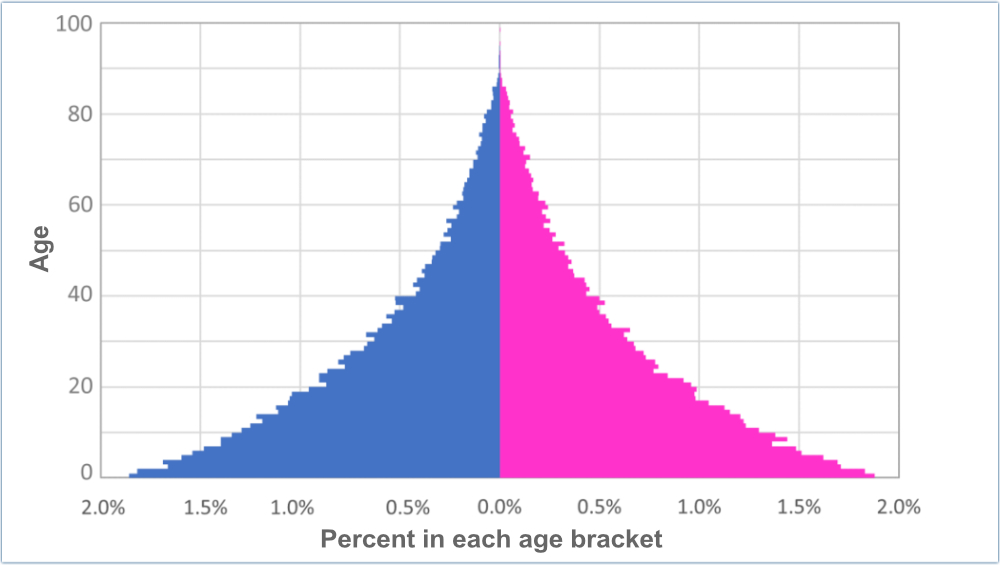
Figure 2. The age distribution at model year 1,000 for a default population of 100,000 individuals. Males are in blue, females in pink.
In terms of generations, the population took on a similar overlapping generation spectrum as seen earlier.11 Over time, variability in the minimum number of generational steps between the people in the model and Noah increased. For example, at year 1,000 in the default population model, a handful of people could be as few as 15 generations or as much as 33 generations from Noah.
The model produced reasonable results for changing lifespans over time (figure 3), with individuals often reaching a significant fraction of their maximum lifespan. We can also estimate the fraction of people who lived for any number of years (figure 4). Over the first 1,000 years in one model run, 3.3 million people were born into the population. More than 99% of them died before the age of 90. Only one out of every 100,000 people lived to the age of 300. Put another way, very old people quickly became a vanishingly small proportion of the population over time (figure 5). At model year 100, the six founders (the blue dot at year 200 above the main line in figure 5) lived among a very young but rapidly growing population. By model year 200 (orange line in figure 5), they were still alive but represented a very small fraction of the total.
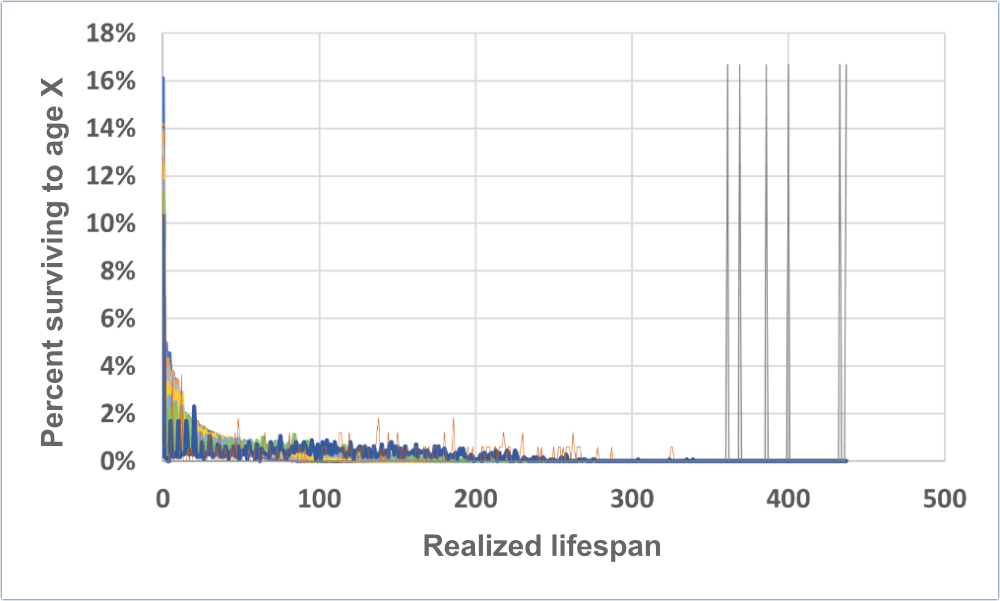
Figure 3. Maximum vs realized lifespans. Each coloured line represents one lifespan cohort. For example, the six founding individuals (tall grey peaks on the right) had a maximum lifespan of 698 years but managed an average lifespan of about 400 years in this model run. Some of their children (blue line) lived long lives but others died much younger.
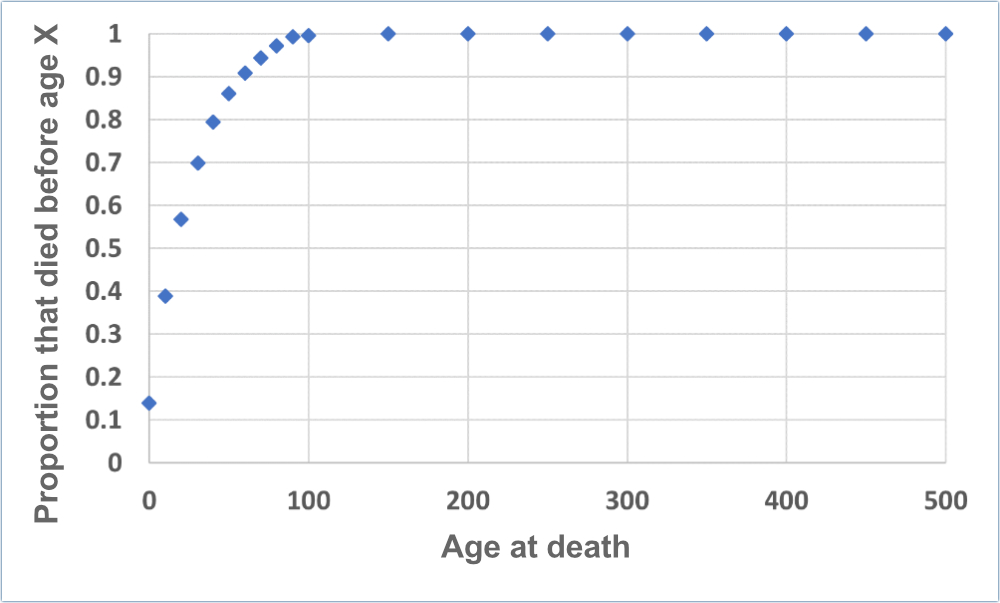
Figure 4. Cumulative distribution of people dying before a given age across 1,000 years in a default population of 100,000 individuals
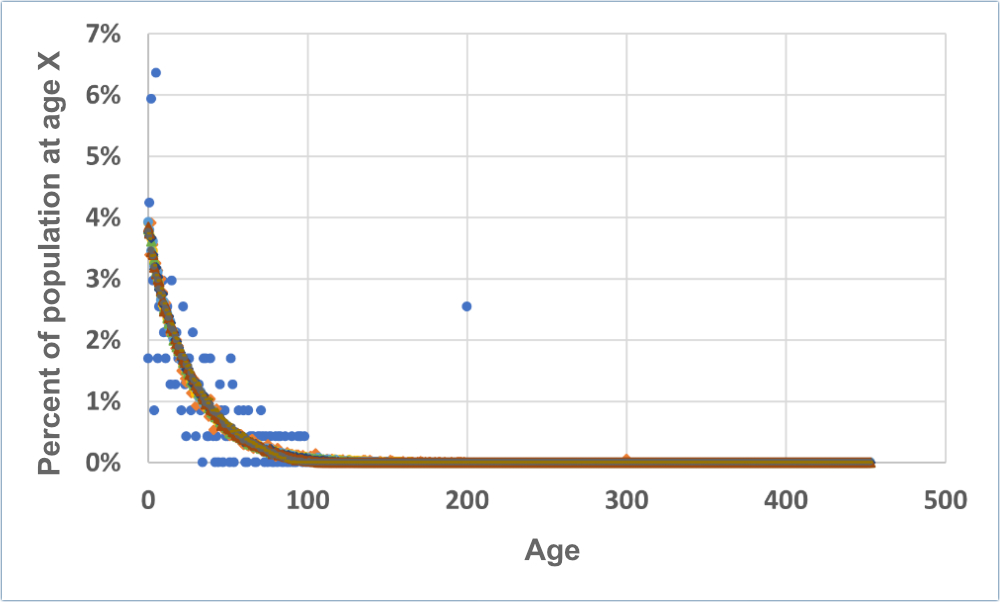
Figure 5. Percent of the population at any given age in a default population of 100,000 individuals. Data were collected at 100-year intervals.
Discussion
Assigning ages to skeletal remains is not an exact science. After examining hundreds of human cadavers specifically to develop age-dating methods, pathologists have devised several metrics that can be used to estimate age at death. Some are more accurate than others, but it has long been known that it is easier to accurately determine the age of younger people than older people. Children go through dramatic and highly characteristic growth stages, and most (modern) human children follow a life history pattern with little variation in timing. The sexes can be differentiated after puberty, and childbirth can often create visible changes to the pelvic region, but aging of the skeleton is regulated by genetic, epigenetic, and environmental factors.15 Thus, in isolation, most measures are poor metrics of age. Yet, several aspects of the skeleton (when available) are generally examined, and the results pooled. This includes examination of pubic symphyses (bone fusions in the pelvic region), certain aspects of the ends of the sternal ribs and the auricular (lobed) portion of the ilium, and the degree of fusion in cranial sutures.16 Tooth wear, bone porosity, and other measures can be included in these assessments. In the end, age-dating skeletons is an art that requires considerable expertise.17
It would be very difficult to tell the difference between two skeletons with different rates of maturation. Cuozzo (1994) noted that the teeth of Neanderthal children fossils often display more tooth wear than they should.18 Although this was controversial within creationist circles, this could indicate that Neanderthals developed more slowly than modern humans. If so, modern approaches to age-dating skeletons might not apply to Neanderthals, or indeed to any ancient individual. Considering that ageing is related to development, if a person was destined to live for centuries, perhaps sexual development was also delayed. Delaying puberty by only five years or so would have a major impact on age estimates when people were expected to live for only 40 or 50 years in the ancient world. Thus, there are no modern proxies for biblical lifespans and the question of what we should expect to see in the skeletons of very old people is an open question.
It also must be pointed out that old people don’t start out old. Even in a population where some individuals could live for centuries, a) they start out at age zero, and b) the population will continue to be dominated by young people as they transition into an above-average lifespan. Because of this, ancient burial sites should be dominated by people who died young.
People must also survive long enough to grow old. Potential age is not the same thing as realized age at death. The famous Neanderthal burials at Krapina showed evidence that the community nurtured injured individuals who survived things like fractured bones. Yet, skull fractures and other evidence of blunt-force trauma to the skull are evident in multiple individuals.19 Whether the injuries were due to fighting/warfare or simple environmental hazards, they show that the world in which these individuals lived was quite dangerous. It would be unlikely for anyone to live to a great age in such circumstances.
The steady decay of post-Flood lifespans indicates that these are not random deaths caused by disease, warfare, or starvation. Yet, the Bible does not say that the Patriarchs died of old age. The Bible also does not say the listed Patriarchs are the first-born children. There are seven generations in a row (Arphaxad through Nahor) where the named son is born when the father is approximately age 30 (31.4 ± 2.3 SD). This is curious. Are these first-born sons? If so, people were delaying marriage at least a decade longer than the modern average. Alternatively, these could be the oldest legitimate children. Concubinage is quite common among royalty worldwide (e.g. Abraham + Hagar, Jacob + Bilhah and Zilpah, etc.), and the Patriarchs would have been at least chieftains, if not princes or kings, in the post-Flood world. Or perhaps this is simply a genealogy of Abraham and is not intended to be seen as a list of first-born children.
There is something special about Abraham, however. First, he is associated with the Patriarch Eber, who is singled out for special treatment in Genesis 10:21. Abraham is called an Eberite (aka Hebrew) when Lot was captured (Genesis 14:13), immediately prior to the famous Melchizedek passage. Abraham comes from the house of Eber and had some understanding that this was important. Is it possible that Abraham was the scion of a long lineage of first-born sons, tracing back to Eber, or even to Noah? If so, this might explain how the family records came into his possession (I assume that Moses was not inspired to write everything down with no prior written records from which to consult). This might also speak to the events surrounding Abraham and Lot (whom Abraham protected with great care). Instead of Abraham, perhaps Lot was the namesake, having been born of Abraham’s older brother? Note that we do not know how old Terah was when Abraham (then Abram) was born, nor do we know the birth order of the three brothers (Abram, Terah, and Nahor). There are several possibilities that fit the biblical data,4,20 yielding ages from 70 to 180 for the age of Terah at the birth of Abram. Either way, the pattern of ‘about 30’ is broken with Terah (Genesis 11:26, cf. Genesis 5:32). Why, after so many evenly spaced generations, did Terah suddenly wait until he was over 70 to father the three listed sons? This delay would have added to the paradox of having long-lived people in a population of otherwise short-lived people.
Over time, older siblings have more descendants than younger siblings. There are many examples in the modern world where a woman who is already a grandmother has a child later in life. This makes her grandchildren older than their aunt or uncle. In a world where people are living for centuries, it is entirely feasible for them to have a child at the age of, say, 20, and another at 100. By the time that second child is born, the first could be a great-great-great grandparent with hundreds of living descendants. Thus, mathematically, all populations will eventually become dominated by people with the maximum number of generational steps from the originals. If post-Flood lifespans were tied to generational steps, the world would quickly fill with short-lived people.
Another way to illustrate the dilution of long-lived people in a biblical scenario is to simply make a chart of a long, stylized genealogy. Consider the scenario in figure 6. Assume this is a paternal tree that only lists fathers and sons. Each man in this tree had a son at each time step. The founding man (indicated by the yellow circle) had six sons in all (indicated by yellow halos). But during this time series, the sons did not have an equal number of descendants. They had, respectively, 31, 15, 7, 3, 1, and 0 descendants. This discrepancy is made even worse when you consider that children are not born in even time increments like this. The delay between birth and an individual’s childbearing years is much greater than the average time between children. Younger children are penalized more than this chart indicates. Thus, all populations should be dominated by the descendants of oldest children. If the decrease in post-Flood lifespan was at all linked to generational steps from Noah, this would ensure that lifespans would decrease at the maximum possible rate. In the end, the post-Flood population was saturated with short-lived people, even though long-lived people continued to produce long-lived children for several centuries.
These results are based on multiple simplifying assumptions, so some caution is warranted when drawing conclusions. However, adjusting most of the life history parameters in the model would only exacerbate the stark contrast between long-lived and short-lived people. For example, if the age of maturation was made proportional to lifespan, short-lived people would even more quickly dominate the population. The same would happen if long-lived people spaced children father apart. There is room for further experimentation, and the current results do not give any specific answers, but what is clear is that there should be vanishingly few very old people buried in ancient gravesites.
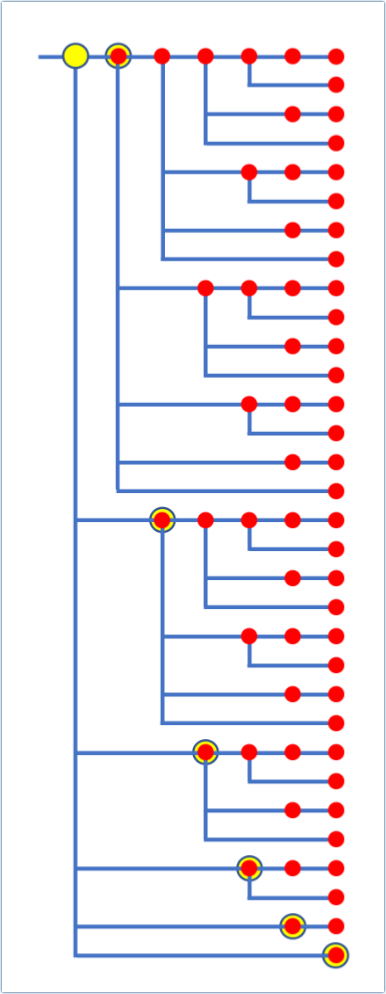
Figure 6. A stylized male-line genealogy of a single man (yellow circle) over time. Each individual has a son at each time step. The starting man has six sons in total, each with a very different number of descendants.
References and notes
- Sarfati, J., Biblical chronogenealogies, J. Creation 17(3):14–18, 2003.
- Carter, R., The rapid decline in biblical lifespans, 5 Oct 2021.
- E.g. Rana, F., Why aren’t there any 900-year old [sic] human fossils? Reasons to Believe, 1 Oct 2005.
- E.g. Olson, C., How old was father Abraham? Re-examining the patriarchal lifespans in light of archaeology, Southwest Regional Meeting of the Evangelical Theological Society Mar 31–Apr 1, 2017.
- For a list of the names included, their ages at death, and the number of generational steps from each individual to Noah, see table 1 in reference 2.
- Carter, R. and Sanders, L., How long were the Israelites in Egypt? 21 Sep 2021.
- Hardy, C. and Carter, R., The biblical minimum and maximum age of the earth, J. Creation 28(2):89–96, 2014.
- López, R.E., The antediluvian patriarchs and the Sumerian King List, J. Creation 12(3):347–357, 1998.
- Stump, J., Long life spans in Genesis: literal or symbolic? Biologos.com, 5 Oct 2017.
- Hardy, C. and Carter, R., Modelling biblical human population growth, J. Creation 29(1):72–79, 2015.
- Carter, R.W., Effective population sizes and loss of diversity during the Flood bottleneck, J. Creation 32(2):124–127, 2018.
- Carter, R.W. and Powell, M., The genetic effects of the population bottleneck associated with the Genesis Flood, J. Creation 30(2):102–111, 2018.
- Carter, R.W., Patriarchal drive in the early post-Flood population, J. Creation 33(1):110–118, 2019.
- Actuarial tables courtesy of The United States Social Security Administration | SSA. Return to text.
- Goltzman, D., The aging skeleton, Adv. Exp. Med. Biol. 1164:153–160, 2019.
- Priya, E., Methods of skeletal age estimation used by forensic anthropologists in adults: a review, Forensic Res. Criminol. Int. J. 4(2):41–51, 2017.
- C.f. Perkel, J.M., A simple approach to dating bones, Nature 568:579, 2019. Return to text.
- Cuozzo, J.W., Neandertal children fossils, J. Creation 8(2):166–178, 1994.
- Gardner, J.C. and Smith, F.H., The paleopathology of the Krapina Neandertals, Periodicum Biologorum 108(4):471–484, 2006.
- Sibley, A., Was Terah dead when Abraham left Haran? Views on the meaning of Acts 7:4, J. Creation 31(2):78–83.


Leave A Comment
You must be logged in to post a comment.